
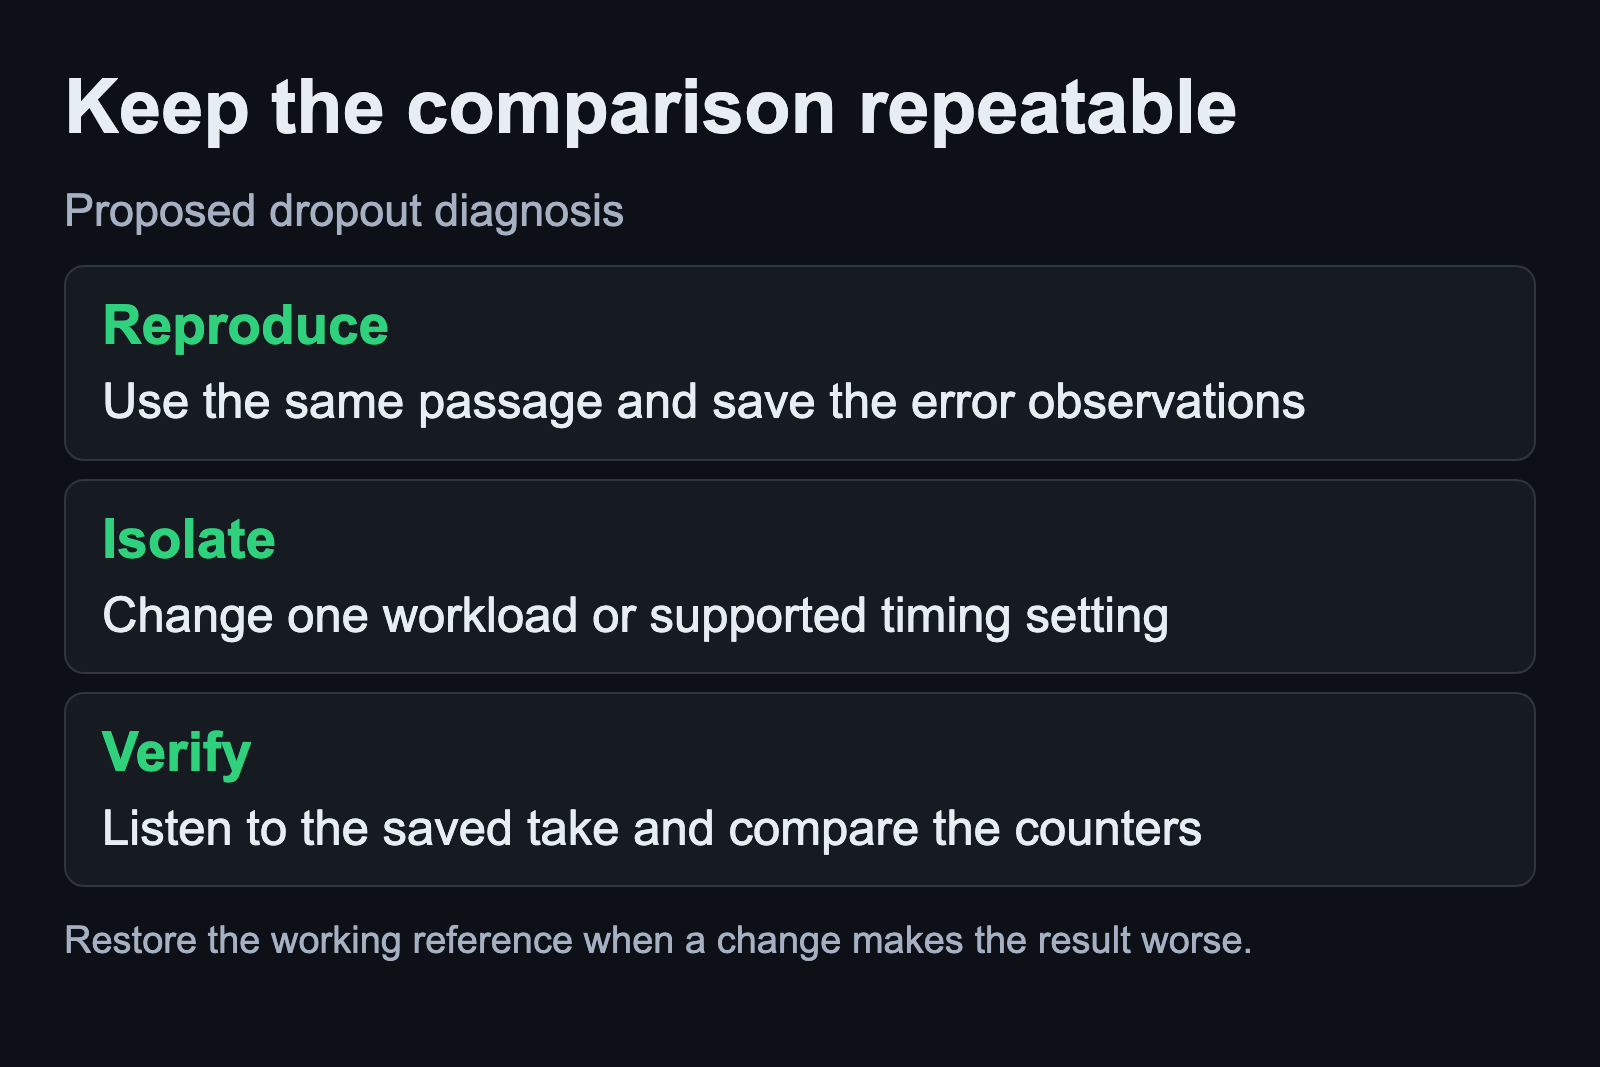
When Linux audio drops out, record what was happening when the error counter changed. Use the same project, passage, interface and buffer setting to reproduce it. A repeatable trigger gives you something to compare; changing several settings after every click or pop makes the cause harder to identify.
This guide assumes Ubuntu Studio 24.04 with PipeWire and an Ardour recording session. It describes an isolation procedure rather than a guaranteed repair. Keep a working session copy and the previous audio settings before you experiment.
Read what the error actually means
The ALSA PCM documentation distinguishes an underrun during playback from an overrun during capture. Both belong to the xrun category. The direction matters because one concerns supplying playback audio in time and the other concerns consuming captured audio in time.
In PipeWire, an error counter can include more than one kind of failure. The Ubuntu pw-top manual defines ERR as the total of xruns and errors. A rising number is evidence worth investigating, but it is not a diagnosis of a specific plugin or a defective interface.
Keep ordinary routing silence separate from this problem. If a track receives no input or has no connection to playback, inspect the route first. A buffer change cannot create the missing connection. Write down whether the symptom is silence, a delayed monitored signal or an interruption during otherwise working audio.
Capture a small set of observations
Run the process viewer while the reference session is active:
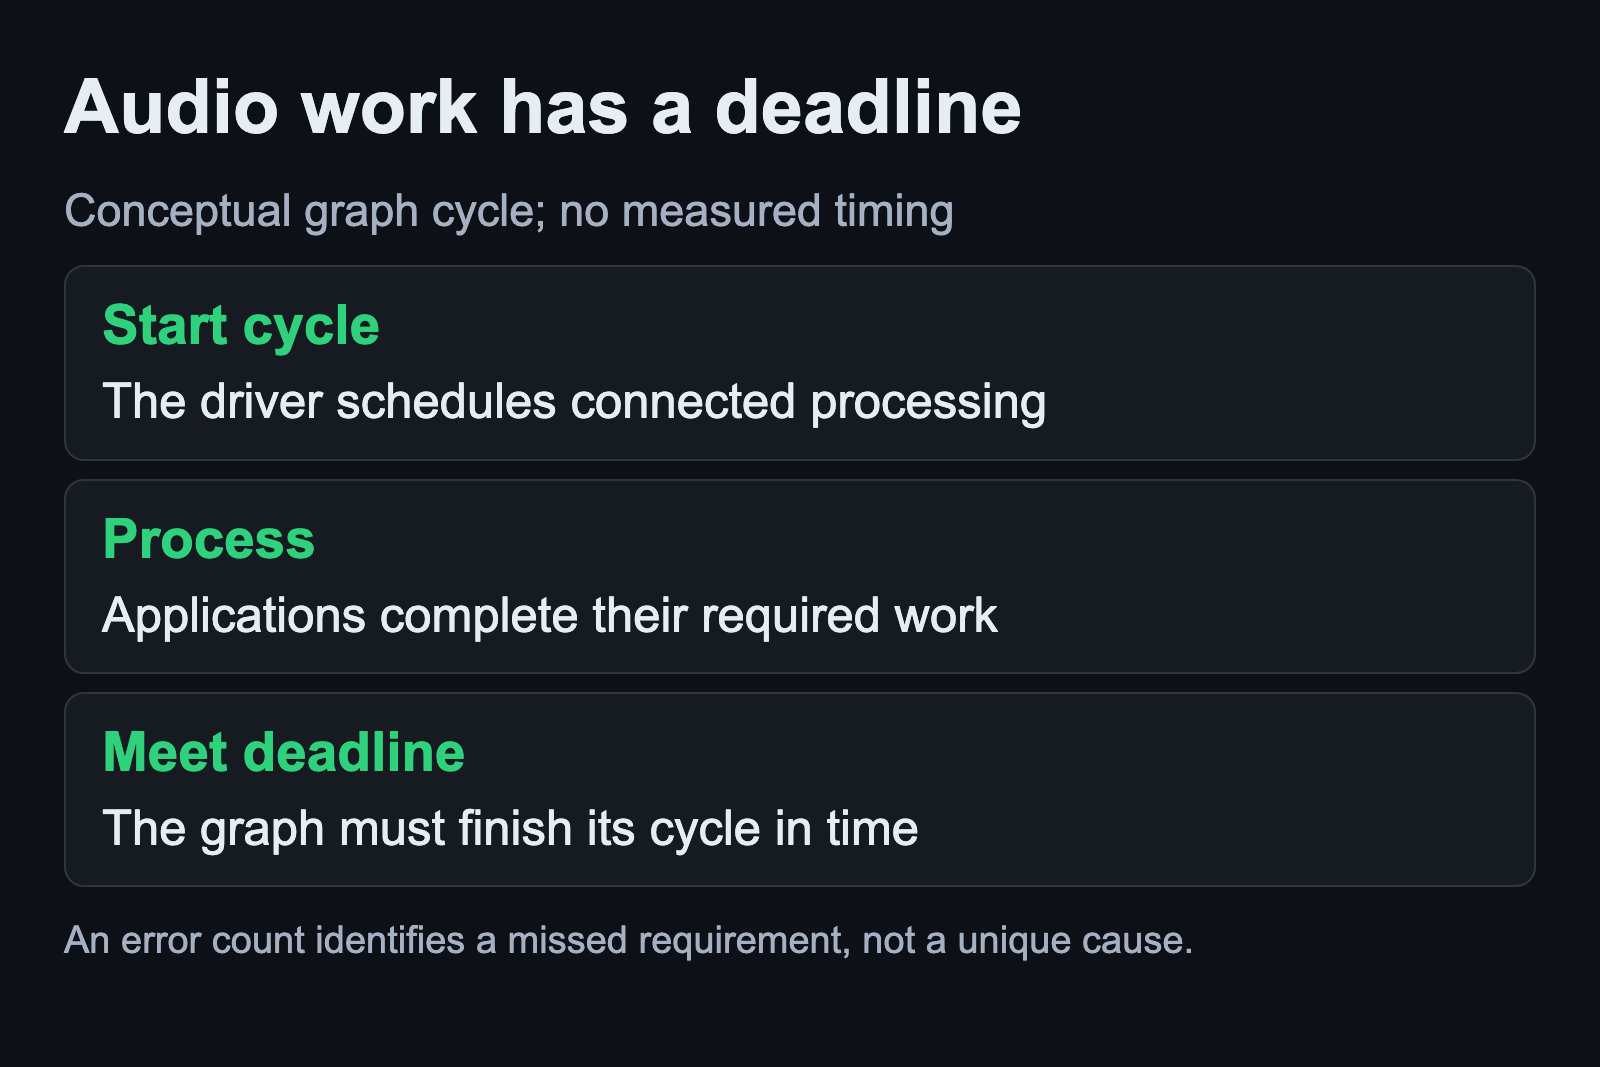
pw-topFind the driver and its follower rows. The manual describes a driver xrun as a graph cycle that did not complete, including cases involving scheduling delay. A follower can miss its own processing deadline. Look at which rows change around the audible event rather than reading a total in isolation.
For a finite text capture, the documented batch and iteration options can be combined:
pw-top -b -n 3Three iterations is simply a short observation length chosen for this example. It is not a stability threshold or a recommended test duration. Repeat the capture around the actual trigger if the short sample misses it, and keep your notes tied to what the recording was doing.
Compare the audio workload with its deadline
The process viewer distinguishes graph load from the work attributed to individual nodes. Its driver W/Q value and node B/Q value answer related but different questions. Use the labels in the manual when interpreting them, and avoid treating a desktop’s average CPU percentage as the same observation.
Record the active driver quantum and rate as well. They determine the duration of a graph processing period. That period is one timing component; it is not a complete measurement of the delay from physical input to physical output. The audio latency guide explains the distinction.
Choose a repeatable passage with the processing your project actually needs. Compare a copied session with a suspected processor bypassed or a reduced workload, changing only one factor. This is a proposed diagnostic experiment. Improvement suggests where to investigate further; it does not establish that the removed component is universally faulty.
Try a supported timing change separately
If the reference configuration repeatedly misses deadlines, compare a larger supported buffer or quantum setting while keeping the project and interface unchanged. Record the previous value. Ubuntu Studio Audio Configuration documents the distribution utility and notes that its changes are system-wide.
Reopen the same session and inspect the active graph values after the change. Listen for the original interruption and note whether the counters still increase. Also assess whether the resulting monitoring delay is acceptable for the part you need to record. A stable playback setting and a comfortable software-monitoring setting can involve different practical requirements.
Do not combine this comparison with a new sample rate, a different USB connection and a new kernel. If the symptom disappears after all of those changes, you have a working configuration but little evidence about which change mattered. Preserve that result, then simplify the comparison only if further diagnosis is necessary.
Listen to the recorded take
The Ardour Recorder documentation treats a take’s xrun count as a warning about recording quality, even when an artifact is not obviously audible. Listen to the saved material at the location where the event occurred. Keep the recording and its notes together while deciding whether to repeat the take.
Do not erase the last take as a troubleshooting reflex. A recording can help establish whether an interruption reached the file or only affected the listening path. Preserve the evidence until you have a clear replacement and understand the result.
Consider a kernel change only after the simpler checks
The JACK kernel FAQ says most users do not require an RT kernel. That is a reason to investigate the observed workload and scheduling conditions first. It does not promise that every stock configuration can handle every recording session.
If a kernel experiment remains justified, use the low-latency kernel checklist to preserve a reference and recovery path. Keep its result tied to the same recording test. Avoid unexplained scheduler-limit changes or numeric tuning recipes copied from another machine.
Sources and scope
Definitions and commands come from ALSA, Ubuntu PipeWire and Ardour documentation. The comparisons described here are proposed tests; no xruns were induced or benchmarked for this article. Sources checked September 6, 2026.