
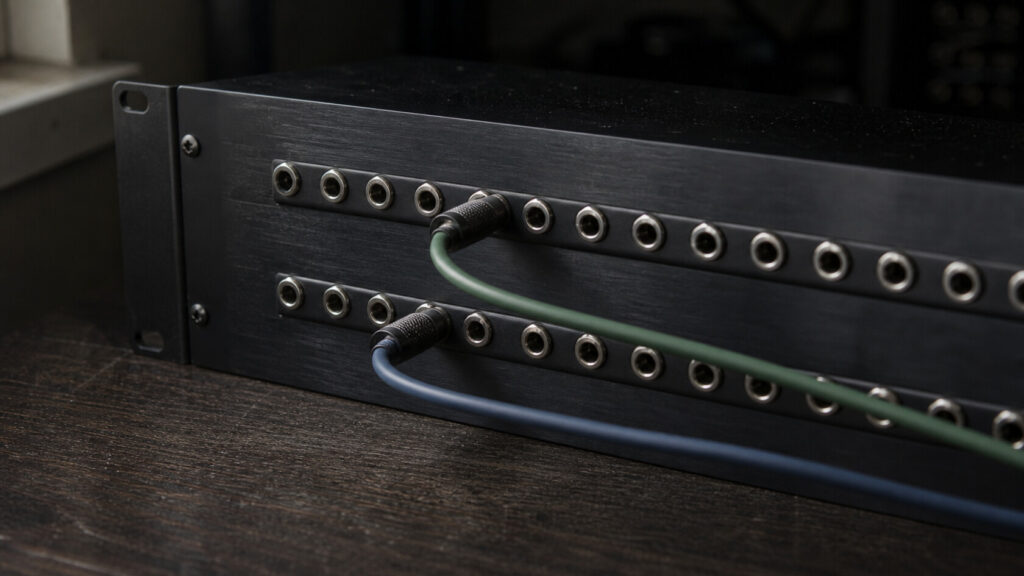
Start a PipeWire recording setup by naming the physical inputs and outputs you need. A microphone input, a stereo listening output and an extra headphone feed are different requirements. Check that the chosen device exposes those channels and that your recording application connects to them before reducing buffers or changing system configuration.
This guide assumes Ubuntu Studio 24.04 for the observation commands and distribution utility. It also explains current upstream documentation about the Pro Audio profile. Interface names, available profiles and channel counts depend on the connected hardware. The procedure does not assume that every device offers the same choices.
Record the current device and profile
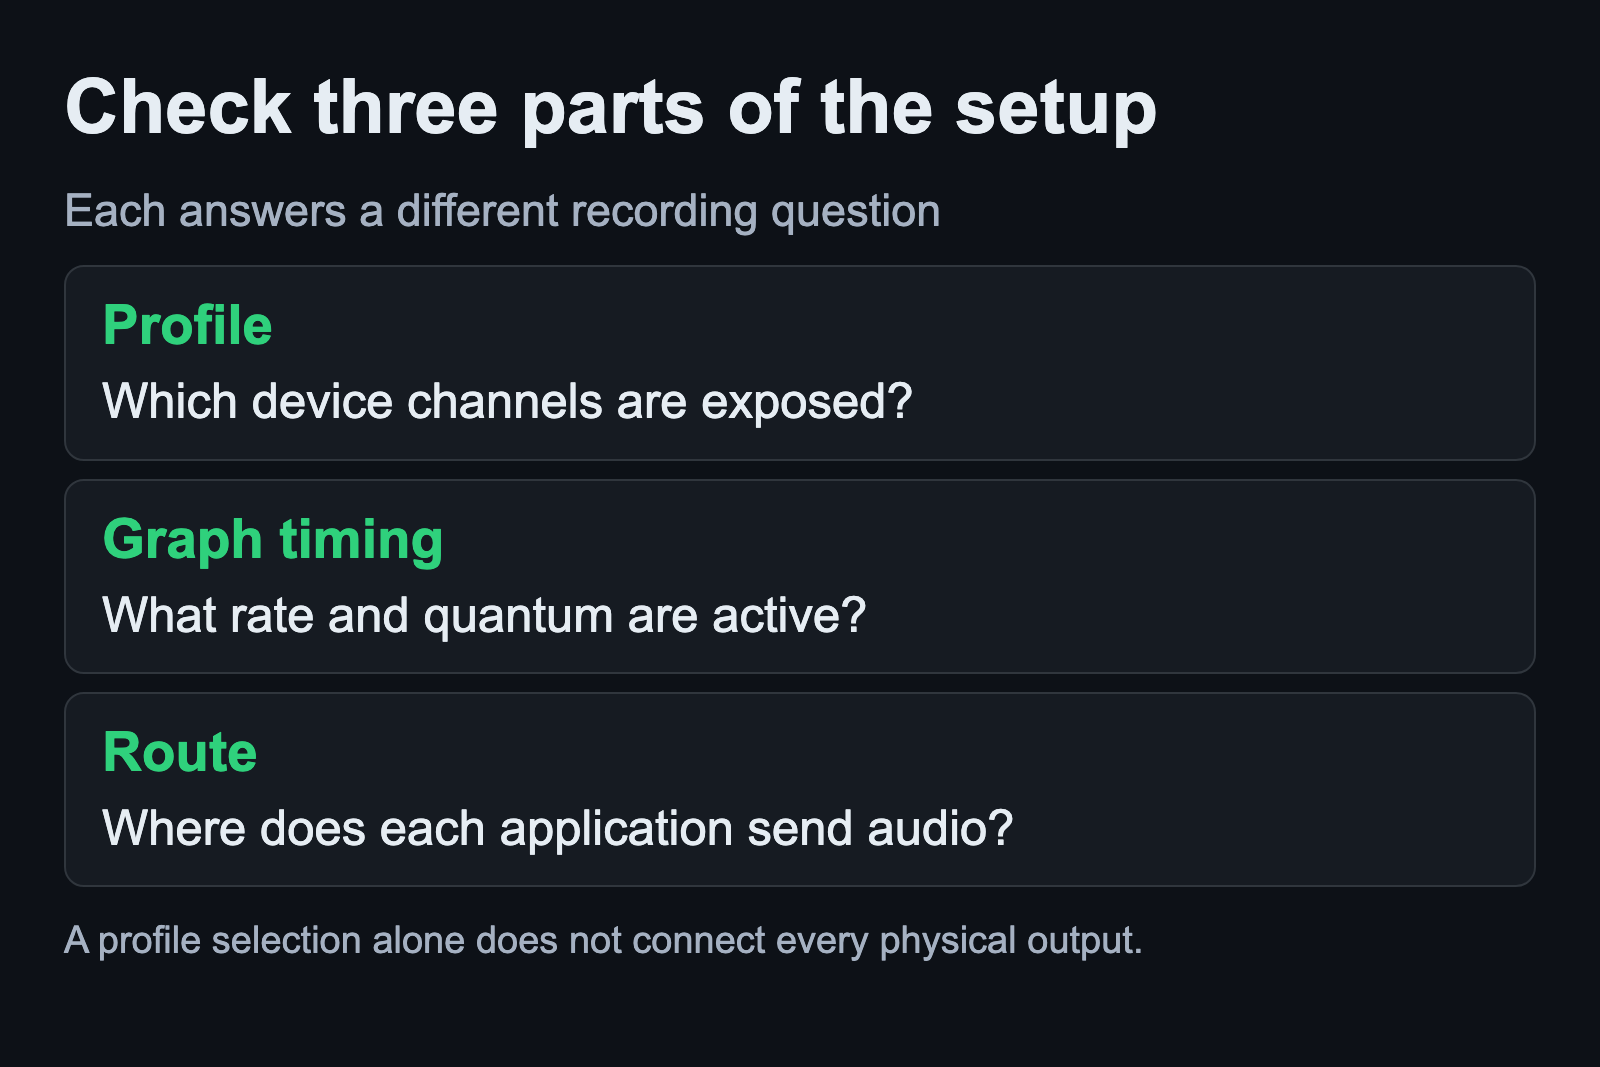
Open the audio controls supplied with your desktop and record the selected interface and its profile. If recording and playback already work through the channels you need, preserve that as a reference. A profile change should answer a concrete need, such as exposing the intended set of hardware connections.
The WirePlumber ALSA documentation explains that its monitor creates PipeWire devices and nodes for ALSA cards. It also distinguishes the physical card from logical access points. That distinction helps explain why one interface can appear as several usable endpoints.
The upstream PipeWire property reference describes Pro Audio channel probing and clock assumptions. In this mode, nodes belonging to the same device are assumed to share a clock. This is a specific statement about one device; do not extend it to unrelated interfaces connected to separate USB ports.
Pro Audio is therefore a device-profile choice with defined behavior. The name does not establish a sound-quality improvement or guarantee a lower measured monitoring delay. If you compare profiles, write down which capture and playback channels appear and whether their labels correspond to the connectors you intend to use.
If you are deciding which implementation to run, read the JACK and PipeWire comparison before replacing the current audio service.
Inspect the active graph while audio is running
Open a simple recording session and run the observation command documented in Ubuntu’s pw-top manual:
pw-topFind the relevant driver and application rows. The driver row reports the current graph quantum and rate; follower rows can show suggestions. Read the active driver values while the session is doing useful work. A remembered setting from a configuration screen can differ from the graph state you are inspecting now.
Also note whether errors accumulate during the test. The ERR column includes xruns and errors, while FORMAT describes the negotiated device or stream format. These observations help separate a timing problem from a missing route. They do not identify the cause of every dropout, and an idle graph is a poor substitute for testing the session you need to record.
Read runtime settings without changing them
The Noble pw-metadata manual provides a read-only settings example:
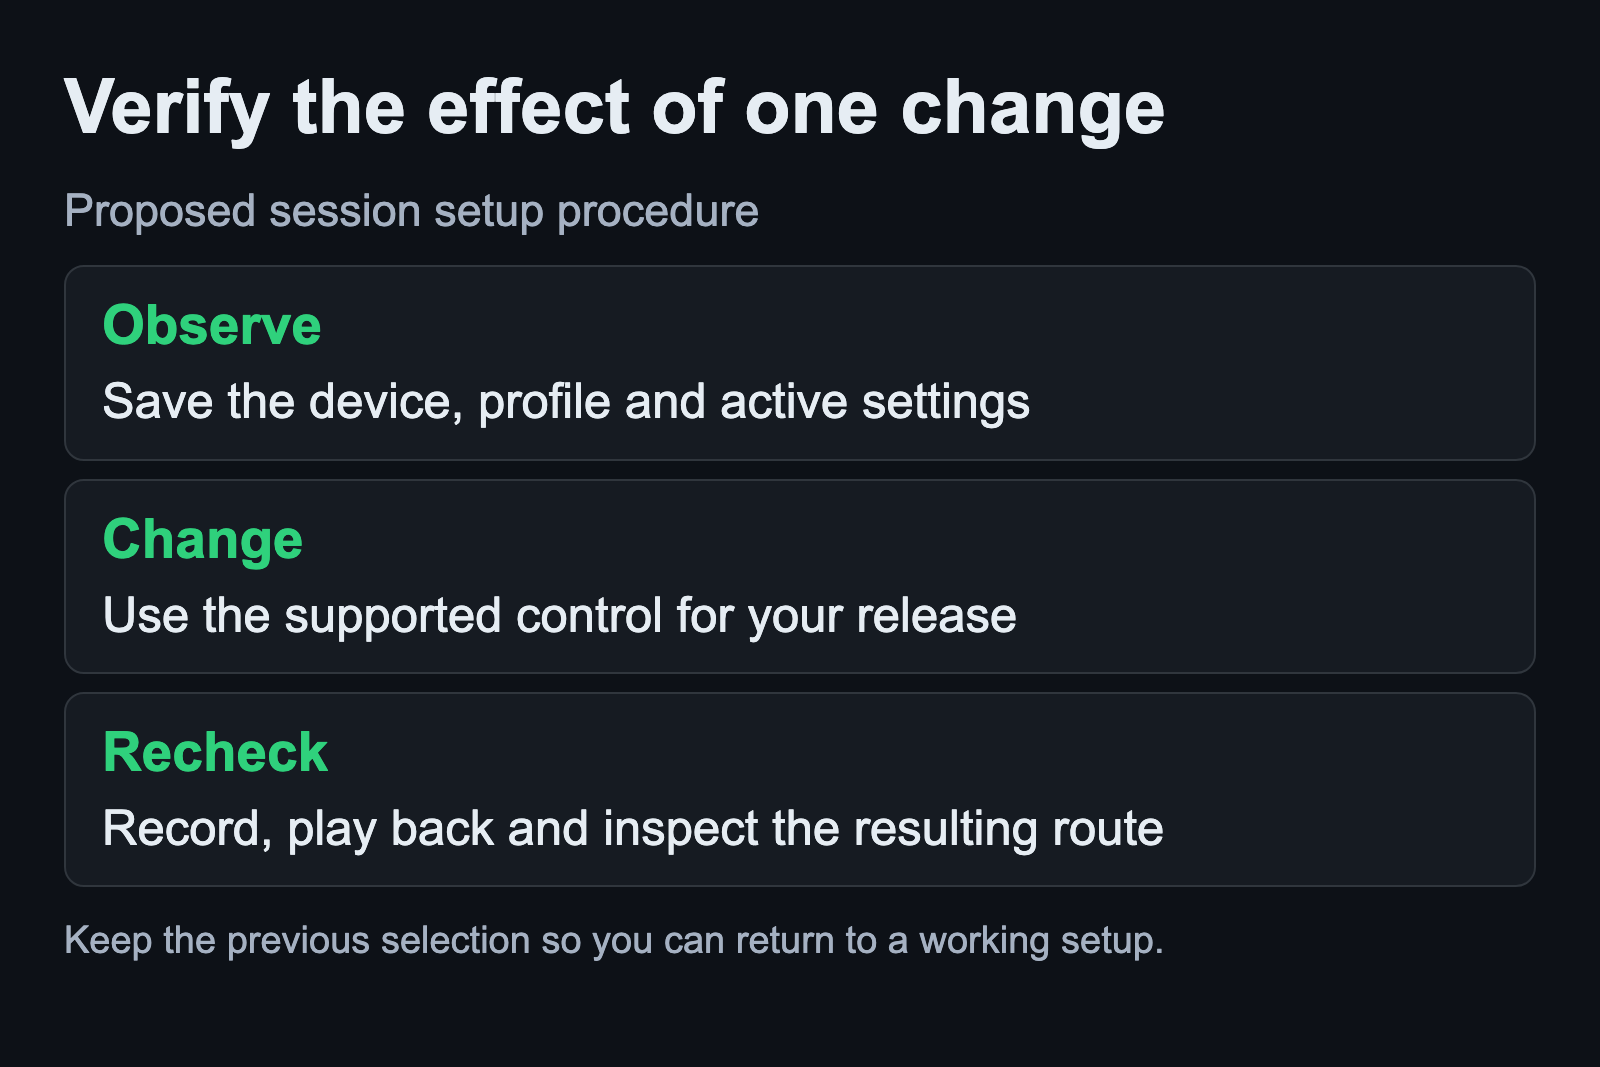
pw-metadata -n settings 0Save the output with your session notes. This command supplies no new value, so it queries the settings. Adding a value changes the operation into a write. Keep observation and modification separate while you establish the reference, especially if another guide previously asked you to force a graph setting.
The upstream PipeWire runtime reference distinguishes default quantum from temporarily forced quantum. A forced choice can affect how the graph responds to application requests. Check for an existing override before deciding that a desktop control failed to apply. This article does not supply an arbitrary forced value.
Use the distribution control for a timing change
Ubuntu Studio Audio Configuration provides a utility for quantum and sample-rate configuration on the stated release. Its changes are system-wide and require administrator authentication. Save active work and record the previous value before using it.
Change one setting for a clear reason, then return to the same session and inspect the graph again. Confirm that the selected rate is supported by the interface. For the relationship between buffer duration and the delay you hear, use the Linux audio latency guide. Complete monitoring delay includes more than a graph period.
Do not combine this step with copying a WirePlumber configuration fragment from a different release. Configuration syntax and supported properties need their own version check. The current upstream documentation linked here explains the concepts; it is not a blanket instruction to paste its example files into Ubuntu Studio 24.04.
Verify each intended recording route
After changing a profile or timing setting, check the application’s actual input and output selections again. Follow a signal from the physical input through a recording track and onward to the intended playback device. The Linux signal-flow guide explains graph port direction and the separate listening path.
Use a short recording with a clear start and stop. Listen to the saved material after recording ends. If a headphone feed works only while playing the instrument, you still need to establish whether that sound came from external monitoring or from the DAW. Repeat the check for any additional input or output that matters to the session.
Keep the working selection and the observed graph values together in your notes. If a change removes needed channels or introduces dropouts, restore the reference and test again. No profile comparison or hardware benchmark was performed for this guide. Its suggested procedure gives you a way to assess the actual result on your own system.
Sources and scope
Commands were checked against Ubuntu Noble manuals. Profile concepts come from current PipeWire and WirePlumber documentation, with no cross-version configuration recipe. Ubuntu Studio’s own utility page establishes the release-specific control. Documentation checked September 6, 2026.